POPULATION
Migration by Geographic Area
Source: Rural Scotland Key Facts 2012
The graph highlights that migration to the three main geographic areas in Scotland is positive between 2009 and 2010. The Annual net migration for remo
te rural is sitting at 0.6%, accessible rural 1% and the rest of Scotland 0.4%. Although the rest of Scotland can be seen to have the largest amount of migration the graph highlights the the greatest increase in net migration is to accessible rural areas.
Relationship Between Population and Land Mass
Studies indicate that the location of a rural community has a large impact on the cost of living and, perhaps more importantly, how living in a rural area can affect the behavior of people in those communities. For people who live in a remote rural area this is shown to have additional cost, for example the manor in which people buy clothing, the travel time required to go to a center of population means that people will be more likely to buy more expensive, more durable, clothing. Therefore the map indicates not only the geographic locations of Remote Rural, Accessible Rural and Rest of Scotland, but also a manor of living.
HOUSING
Housing Demand
Over the next 25 years, the number of households in Scotland is projected to increase by more than a fifth to 2.89 million in 2035. The increase in demand is partly due to increase in population but mainly as a result of changes in household structure. Over the same period the changes in household structure are projected to continue, with average household size falling from 2.17 people in 2010 to 1.95 people in 2035.
Comparision of House Prices and Salaries
Source – Affordable Housing Supplementary Guidance November 2012.
Annual Survey of Hours Office for National Statistics November 2013.
There is a strong influence of inward migration of purchasers from outside the Perth and Kinross area. This can be seen as a contributing factor to house price inflation in the area. The younger working population (16-34 age group) is set to grow by 19% over the next 10 years. This provides implications for the local housing market as there will be an increase in the population of households with lower incomes who may struggle financially to meet their needs in market, especially in the context of the current financial climate. Average earnings in Perth and Kinross are lower than the Scottish national average; this coupled with high property prices makes affordability a key issue.
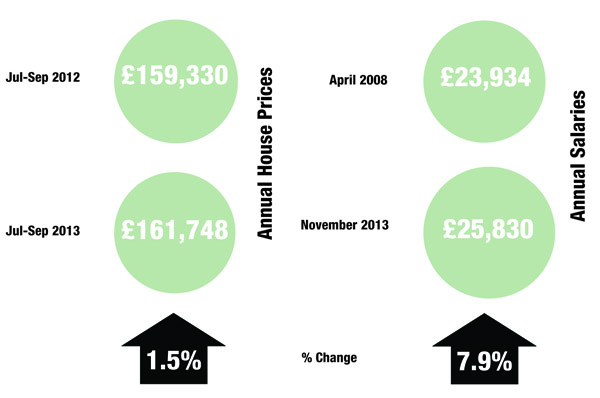
Between 2012 and 2013 the average house prices within Scotland increased by 1.5%, however over the same period of time the average property price in Perth and Kinross dropped by -3.6%. Although there was this large drop the average house still cost £15,904 more than the rest of Scotland.
The annual average salary in Scotland currently sits at £25,830 after an increase of 7.9% since 2008. Perth and Kinross ‘s average salary however has dropped -4.2% to £24,257. In real Value earnings the percentage drop in salaries is even greater as it takes into consideration the inflation rate of 17.8% between 2008 and 2013. Scotland as a whole saw a drop of -9.9% while Perth and Kinross was the hardest hit region in the whole of the UK with a drop of -22%.
ENERGY
Government targets
Source: Scottish Government – Policy Statement 2013-Electricity Generation.
Sub-National Total Final Energy Consumption: 2005 – 2011.
DECC – Domestic Energy Consumption.
Scottish energy study volume 4.
Scottish Government – policy statment 2013 – electricity generation.
– The equivalent of at least 100% of gross electricity consumption from renewables by 2020. – Sourcing 11% of heat demand and 10% of transport fuels from renewables by 2020.
– Enabling local and community ownership of at least 500 MW of renewable energy by 2020.
– 43% reduction in CO2 emissions against 1990 base levels by 2020.
– 80% reduction in CO2 emissions against 1990 base levels by 2050.
– Aim to ensure that by November 2016, so far as is reasonably practicable, people are not living in fuel poverty in Scotland.
While Scotland is a net exporter of energy, the UK as a whole is a net importer of energy. As the rate
of fossil based extraction decreases over time the proposed proportion renewables based
generation must increase at a pace to not only meet green targets but be done so in a manor
which maintains secure and affordable network energy. By 2020, the impact of policies on energy
prices is,on average, expected to be more than offset by the impact of policies which improve energy
efficiency by helping households (and also businesses) reduce energy consumption.


